


The Organic Trade Association has spearheaded and underwritten significant studies on organic trade in its effort to build a sound set of data for organic stakeholders and policymakers when they make their business decisions and design policy.
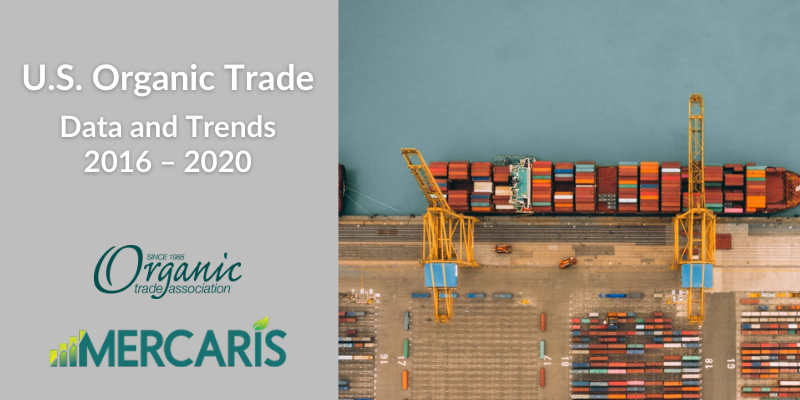
May 2022: U.S. Organic Trade Data and Trends: 2016 to 2020
Driven by expanding consumer demand, organic agriculture continues to demonstrate sustained global growth. The Research Institute of Organic Agriculture (FiBL, 2021) estimates global organic retail sales reached $126 billion in 2019, up 34% from 2016, while the total area dedicated to global organic crop production reached 179 million acres, up 24% from 2016.
The global opportunities for trade have expanded accordingly. The U.S. imported $25 billion of organic crops, or 1.9 million metric tons (MT), over 2020, up 42% from 2016 according to the U.S. Department of Agriculture (USDA) Foreign Agricultural Services (FAS) Global Agricultural Trade System (GATS). Meanwhile, U.S. organic exports reached $647 million over 2020, 373,000 MT, up 17% from 2016.
It should be noted that while the data provided by FAS GATS suggest a growing trend for U.S. organic trade, the amount of detail provided by official measures of U.S. organic trade is limited by the number of unique identifiers available within the harmonized system of codes used to measure international trade. As a result, official trade data currently understates the total scale of U.S. organic trade and its impact on U.S. organic markets.
The broader review of U.S. organic trade conducted by Mercaris on behalf of the OTA in this report confirms that organic trade covered by currently available organic-specific harmonized system trade codes excludes a significant amount of annual trade activity. Specifically, Mercaris found that the U.S. imported more than $4 billion of organic products over 2020, $1.6 billion more than reported under existing organic harmonized system trade codes. U.S. exports of organic products were furthermore found to be $85 million more than reported under existing organic harmonized system trade codes—reaching $732 million in 2020. Mercaris evaluated data from bill-of-lading documents to produce these estimates. In some instances, the description of goods shipped listed on the bill-of-lading data does not include text identifying it as organic. As a result, the estimates generated by Mercaris are likely below the actual total values.
OTA's U.S. Organic Trade Report: 2016 – 2020
May 2017: U.S. Organic Trade Data: 2011 to 2016
Major Themes
- Overall, U.S. organic exports have remained stable over 2013-2016 years.
- The value of organic imports increased by 34.4% from 2014.
- By 2016, the market share of organic imports was higher at 16% than for organic exports at 8.3%.
- Sixty-one percent of U.S. organic exports enter U.S. organic equivalency partners and 21% of U.S. organic imports come from countries with equivalencies. The U.S. exports organic products to at least 104 different countries. The main recipients of these exports were Canada and Mexico.
- East Asia and the Middle East continue to gain market importance. For example, the value of measured organic exports to the United Arab Emirates substantially increased during 2012- 2015 (from $1.2 million to $14.4 million).
- The U.S. imports organic products from at least 111 different countries. Mexico is the leading supplier of organic products to the U.S.
- Since 2013, a little over half of all the U.S. organic imports came from North and South America. Imports from Mexico and Canada represent $324 million annually on average. Imports from South America represent $423 million annually on average from five main countries: Peru ($92.9 million), Ecuador ($71.6 million), Colombia ($64.4 million), Brazil ($64.1 million) and Argentina ($55.3 million). As with exports, proximity is clearly a major factor when it comes to trade of organic products.
- Import spikes in grains such as organic corn and soy are further evidence of the need for transition of domestic acres to organic production of these commodity crops. Note: these imports are largely for livestock feed.
- Thirty- seven percent of the value of organic corn and 26% of the value of organic soybean imports entered the U.S. from organic equivalency partners.
OTA's U.S. Organic Trade Data Report: 2011-2016
Dec. 2016: Organic Product Prices from Around the World
OTA has catalogued 1,435 international organic product prices in this library.
View Library of International Organic Product Prices
Dec. 2015: Impacts from Organic Equivalency Policies: A Gravity Trade Model Analysis
A new report released by the Organic Trade Association shows that organic equivalency arrangements have significantly boosted overseas business for U.S. organic. The study finds that these accords have collectively increased annual U.S. organic exports by 58 percent during 2011-2014 over what exports would have been without any agreement in place. Conducted by Dr. Edward Jaenicke, Associate Professor of Agricultural Economics at Penn State University, the study for the first time singles out organic equivalency policy to scientifically evaluate whether the policy is having its intended results.
The report looks at organic equivalency arrangements between the U.S. and Canada (implemented in 2009), the EU (2012), Japan (2014) and Taiwan (2009). The Taiwanese arrangement is a one-way understanding in which Taiwan recognizes U.S. organic certification. Recent organic equivalency arrangements signed with South Korea (2014) and Switzerland (2015) were not included due to insufficient data. The study focuses on the 2011-2014 period. Learn more about the report in OTA's press release.
OTA's Organic Equivalency Policy Report
April 2015: Preliminary Analysis of USDA's Organic Trade Data: 2011 to 2014
A landmark study on the trade flow of organic food products across the borders of the United States reveals that a robust global appetite for organic food has created new lucrative markets from Mexico City all the way to Hong Kong for U.S. organic producers—but also provides strong evidence that American farmers are losing out on some valuable opportunities by not growing more organic.
According to the study conducted by Pennsylvania State University’s Dr. Edward Jaenicke, associate professor of agricultural economics, released Wednesday by the Organic Trade Association (OTA), exports of U.S. organic foods as well as imports of organic into the U.S. have risen significantly in the past few years. This watershed report compiles, for the first time ever, a comprehensive picture of the officially tracked organic food products sold by U.S. exporters and bought by U.S. importers. Learn more about the report in OTA's press release.
OTA's International Trade Data Report
Contact
|
Data Inquiries:
|
Media Inquiries:
|